
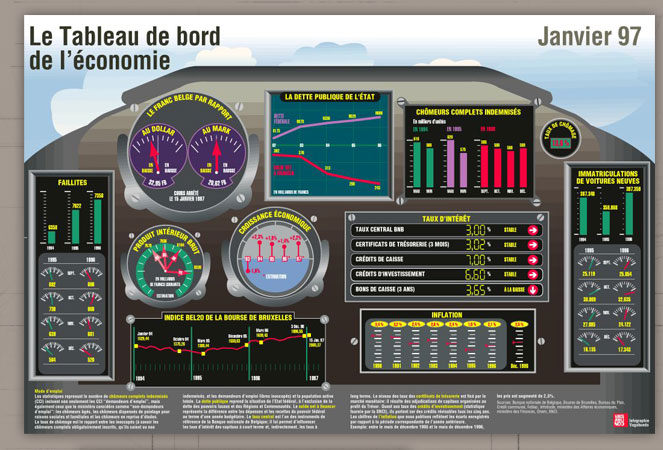

Information graph for the magazine "Le Vif/L'Express" in which several economic data were adapted four times a year. At clicking on the information graph an interactive version of this dashboard will appear.
Client: Vagabundo / Le Vif/L'Express